Signal Sampling: Nyquist - Shannon TheoremTheory A continuous-time (or analog) signal can be stored in a digital computer, in the form of equidistant discrete points or samples. The higher the sampling rate (or sampling frequency, fS), the more accurate would be the stored information and the signal reconstruction from its samples. However, high sampling rate produces a large volume of data to be stored and makes necessary the use of a very fast analog-to-digital converter. It is obvious that a much higher sampling rate is needed for sampling a signal which is rich in high frequency components, such as the sound of music, compared to the sampling frequency needed for sampling a slowly varying signal, such as the output of a gas-chromatograph detector or the potential of a glass-electrode during an acid-base titration. Therefore, the following question arises: Which is the minimum necessary sampling frequency for a given type of signal, that will not distort the underlying information and/or allow its accurate reconstruction? The answer is given by the Nyquist-Shannon sampling theorem, that may be simply stated as follows: The minimum sampling frequency of a signal that it will not distort its underlying information, should be double the frequency of its highest frequency component. If fS is the sampling frequency, then the critical frequency (or Nyquist limit) fN is defined as equal to fS/2.
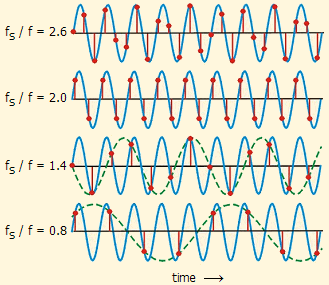
Any sinusoidal component of the signal of frequency f' higher than fN (e.g. f' = fN + Äf) is not only lost, but it is reintroduced in the sampled signal by folding at frequency fN as an alias sinusoidal component of frequency f' = fN - Äf. This effect is known as aliasing (alias: false name). Aliasing is demonstrated in Fig.1. A sinusoidal signal (blue) of frequency f is sampled at four different sampling frequencies fS = 2.6f, 2.0f, 1.4f, and 0.8f.
In the two first cases the sampling rates are adequate enough for the accurate reconstruction of the original sinusoidal signal, whereas in the last two, subsampling occurs, and the collected points may be considered as belonging to signals of lower frequencies. The alias frequencies due to subsampling can be calculated by the following equation: Alias frequency: f´ = | f - k fS | where k = 1, 2, … Hence, when fS / f = 1,4, the alias frequency is f´ = | f - 1x1,4f | = 0,4 f, whereas, when fS / f = 0,8, the alias frequency is f´ = | f - 1x0,8f | = 0,2 f.
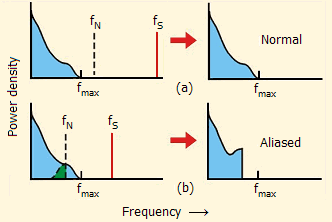
Problems arising due to aliasing. The effect of the sampling frequency on the spectrum of a signal consisting of infinite number of sinusoidal components (see applet "Fourier Analysis and Signal Smoothing") is shown in Fig. 2
In Fig 2a the Nyquist frequency is sufficiently higher from the maximum frequency (fmax) component of the signal and the stored signal is not distorted. The opposite occurs in Fig 2b where fmax > fN, and all frequency components higher than fN are not only lost, but they are also folded at fN and they are added to the other sinusoidal components, corrupting thus the stored signal due to aliasing. A typical application. For the digitalization of sound, a sampling rate of about 6 KHz is sufficient for telephony, since normal human voice does not contain an appreciable amount of frequency components higher than 2.5 -3 kHz. However, a sampling rate of about 40 KHz is needed for the digitalization of music, since frequency components of about 15-20 kHz are common and needed for achieving fidelity of sound reconstruction. Notes: (1) In practice, the sampling rate fS is commonly selected in the range 2,5 x fmax - 3 x fmax. For digital recording of music in CD a sampling rate of 44,1 kHz is commonly used. (2) Prior to sampling, the signal must pass through a low-pass filter which will remove all unnecessary components (e.g. noise) higher than fmax, preventing thus the "contamination" of the stored signal by their aliased frequencies.
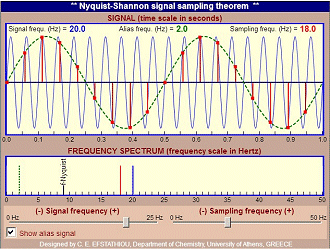
Applet With this easy to use applet, you can observe the effect of the sampling rate on a sinusoidal signal. Using the two horizontal sliders you can select (a) the frequency of the sinusoidal signal (0 – 25 Hz), and (b) the sampling frequency (0 – 50 Hz), independently of each other. On the topmost graphing window, the normal sinusoidal signal (blue) is displayed, and the sampled points (red dots). Whenever aliasing occurs, the aliased signal (green dashed line) is also observed. On the lower graphing window the respective frequency spectrum is shown. The blue line indicates the frequency of the sampled sinusoidal signal, the red line indicates the sampling frequency, and with black color appears the respective critical frequency (f-Nyquist = fS/2). The dashed green line indicates the frequency of the signal resulting due to aliasing, and it appears whenever the critical frequency is less than the signal frequency. A typical example is shown in Fig. 3.
|


